Tables of Statistics
Tables of statistics are illustration components that display statistics for a file.
Two modes are available for statistics tables:
- A population hierarchy displays one or more populations, along with statistics like event count or percent of parent.
- The staining assessment calculates the quality of staining for one or more channels, based on the spread between a positive and negative population.
Tip
Like other plots, tables can be batched to create tables for multiple FCS files at once.
Population Hierarchy
The population hierarchy mode shows information for populations from an FCS file. Each population selected under General options will display a row of information, determined by the selected columns.
The columns determine exactly what statistics are displayed. Options include:
- Population Name, which can be indented by checking indent hierarchy under the Table Layout options.
- Unique Population Name displays the population name; if two populations have the same name, it will also show enough of the path to distinguish each population (e.g. CD45RA populations with different parent populations might show "CD4 > CD45RA" and "CD8 > CD45RA").
- Population Path, including any parent gates back to the Ungated population.
- All of the statistic types, except for quantile, which can only be exported from the Export Statistics page.
To add a table with population statistics to an illustration:
Howto
- Insert a table with the
 button in the topbar. By default, the mode will be set to Population Hierarchy, with a table that shows the population name, percent of parent, and event count for every population.
 - Select the FCS file you want to display, or use batching to create tables for multiple files.
- Optionally, to customize the displayed populations, click on the dropdown under Populations and select the appropriate values.
- Select the desired columns by using the
 and Add Column buttons. For each new column, select the desired statistic from the dropdown. Some statistics will add an additional dropdown box for needed variables (for example, specify the channel to show for a mean.)
 - Optionally, click
 or
or  to rearrange the columns.
 - Under Table Layout, check indent hierarchy to format the Population Name column to show the hierarchy, or uncheck it to remove indents.
Example: Population Hierarchy
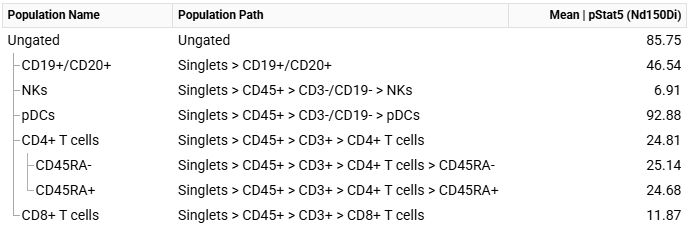
The above example was created to show the mean value of selected cell phenotypes, with the following changes:
- General ⮞ Populations: Only the populations of interest were left checked.
- Table Columns: Event count and percent of parent were replaced with population path and mean. pStat5 was chosen for the mean.
Staining Assessment
The staining assessment calculates the spread between a positive and negative population from the same FCS file. The results can be displayed numerically, or as a textual grade. By selecting mutually exclusive populations for a marker, the results can provide insight into staining quality.
Calculations
The staining assessment uses a robust estimate of the strictly standardized mean difference (SSMD, \( β \)) to calculate the a score that quantifies the separation between the positive and negative populations:
$$ \hat{β} = \frac{\tilde{X}_P - \tilde{X}_N}{1.4826\sqrt{\tilde{s}_P^2 + \tilde{s}_N^2}} $$
where \( \tilde{X} \) is the median and \( \tilde{s} \) is the median absolute deviation for the positive (\( P \)) or negative (\(N\)) population.
This is similar in nature to the staining index, \( \frac{\overline{X}_P - \overline{X}_N}{2 σ_N} \), but provides two key advantages: it reflects the spread of the positive population, and it works better with CyTOF data, which typically has a very low standard deviation for the negative population.
A table with staining assessment can also show a textual grade, derived from the numeric score.
| Score | Grade |
|---|---|
| β < 1 | Very poor |
| 1 ≤ β < 2 | Poor |
| 2 ≤ β < 3 | Moderate |
| 3 ≤ β < 4 | Good |
| 4 ≤ β | Excellent |
Warning
The SSMD in CellEngine reflects the visual separation of populations with data scales applied. Changing the data scales will change the SSMD, so it is critical to set your scales correctly before using this feature.
For more information:
- Zhang, Xiaohua H.D. A pair of new statistical parameters for quality control in RNA interference high-throughput screening assays at https://pubmed.ncbi.nlm.nih.gov/17276655 - introduction of the SSMD for quality control.
- Zhang, Xiaohua H.D. A new method with flexible and balanced control of false negatives and false positives for hit selection in RNA interference high-throughput screening assays at https://pubmed.ncbi.nlm.nih.gov/17517904/ - introduction of the SSMD in high-throughput screening.
- Zhang, Xiaohua H.D. Strictly standardized mean difference, standardized mean difference and classical t-test for the comparison of two groups at https://doi.org/10.1198%2Fsbr.2009.0074 - discussion of SSMD for comparisons in general.
- Zhang, Xiaohua H.D. Illustration of SSMD, z Score, SSMD, z Score, and t Statistic for Hit Selection in RNAi High-Throughput Screens at https://www.slas-discovery.org/article/S2472-5552(22)07802-9/fulltext - more thoroughly introduces the robust estimate of SSMD.
Creating a Staining Assessment
By default, a staining assessment will be created that shows the channel name and the score. Other information that can be displayed:
- Positive Population and Negative Population show the population names chosen for the calculations.
- Textual Grade shows a grade from very poor to excellent based on the score.
- Positive Median and Negative Median show the raw median values for each marker.
- Positive Scaled Median and Negative Scaled Median show scaled median values.
Howto
- Insert a table with the button in the topbar.
- In options, under General, change the mode to Staining Assessment.
- Select the FCS file you want to display, or use batching to create tables for multiple files.
- Click on the dropdown under Channels, and select all the markers for assessment. Each marker will be added under Staining Assessment options.
- Under Staining Assessment, select a positive and negative population for each marker. Where possible, choose mutually exclusive populations (e.g. for CD20, choose B cells for the positive population and CD4 T cells for the negative).
- Select the desired columns by using the and Add Column buttons. For each new column, select the desired statistic from the dropdown.
- Optionally, click or to rearrange the columns.
Example: Staining Assessment
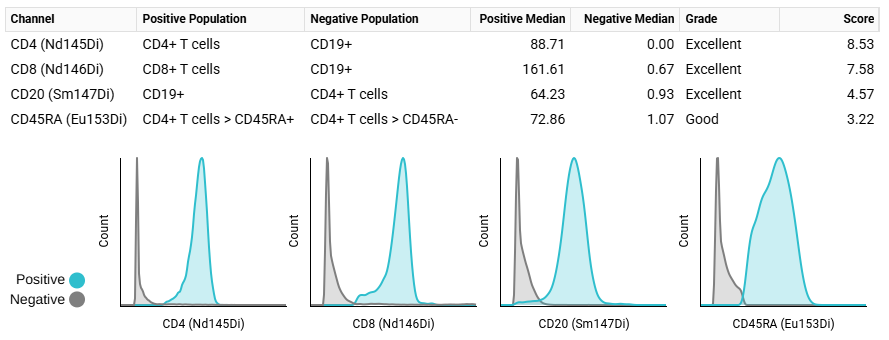
The above example contains a staining assessment table with four markers; for comparison, pivot tables have been created showing histograms for each marker, with the relevant positive and negative populations.
The following settings were used to set up the table:
- General ⮞ Mode: Set to Staining Assessment
- General ⮞ Channels: Selected the channels for the table rows (CD4, CD8, CD20, and CD45RA).
- Staining Assessment: Positive and negative populations were chosen for each channel, with the goal of selecting exclusive populations (e.g. B cells as a negative for CD8).
- Table Columns: Columns were added for textual grade, positive and negative populations, and the positive and negative medians. Column order was adjusted with the up/down arrows.
Downloading Tables
Like other components, tables can be downloaded as a PDF or PNG file.
The data in tables can also be downloaded to a spreadsheet format:
Howto
- Select the table.
- Click on the Download tab.
- Under Export Table, select Download CSV/XLSX.