Batched Illustrations
Overview
Tip
For FlowJo users, this feature is akin to the Layout Editor. For BD FACSDiva users, this feature is akin to exporting the global worksheet for all samples in an experiment.
Batched illustrations allow you to create a template page, and then render that page for each value in a set of variables. For example, you could use flow plots, text boxes and arrows to create a gating hierarchy, and then render that gating hierarchy for all of your FCS files.
Batch variables can be used to control the selected FCS file, x/y channel, and/or population in flow plots, and to insert variable text into text boxes.
Variable iteration in batched illustrations works similar to pivot tables (see the pivoting model), except that batched variables are rendered as separate pages on-screen or in the exported PDF.
Creating a Batched Illustration
Howto
-
Create a new illustration. In the top menu bar, click on the batched illustration checkbox.

-
Insert components such as text boxes, flow plots and lines/arrows to create your template.
While a flow plot is selected, enable batching for the desired settings in the settings panel on the right.
-
If this is the first time in this illustration that you have enabled batching for that variable, the settings will say “No value specified!” Click the CHANGE PAGE VARIABLES button to set up the variable.
-
In the Page Variables dialog that opens, select the variable name(s) for which you have enabled batching.
- Select the values that you want to iterate. You can also toggle the All switch, which will use all values, even if you upload more FCS files or change annotation values in the future.
-
Optional: Click on ADD BATCH VARIABLE to create additional variables. When batching more than one variable, each combination of variables will be generated.
-
Click CLOSE.
Tip
Tip: If at any time you need to change these selections, click the PAGE VARIABLES button in the top toolbar.
-
To insert text variables into a text box:
- Click on the
 dropdown in the toolbar. (This button is on the far right of the toolbar; depending on your browser window size, you may need to click
  before you can see it.)
 -
Select your variable from the dropdown list. These show up with dotted outlines in the text box:

- Click on the
-
Continue laying out your illustration as desired.
-
Use the flipper at the bottom of the screen to view your illustration for different batched variables (pages).
-
To export your illustration as a multi-page PDF, click on File in the menu, and select Download as PDF.
Tip
You may prefer to enable a fixed page size instead of the default extra-large page size. Do so using the File > Page Size menu.
Example: Exporting a gating hierarchy for all FCS files in your experiment
Howto
-
Create a new illustration.
-
Check the Batched Illustration checkbox.
-
Insert a flow plot.
-
With the flow plot selected, enable the Batch switch for the FCS File setting in the settings panel, and then click CHANGE PAGE VARIABLES.

-
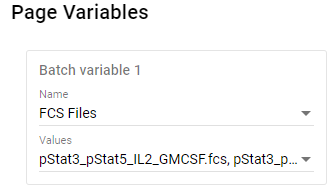
In the Page Variables dialog that opens, for Batch variable 1, select “FCS Files” and select all of your files. Close the dialog.
-
Continue laying out your illustration, using flow plots, text boxes, lines/arrows and other components as desired to create your gating hierarchy.
Tip
You can copy and paste the first flow plot or select multiple flow plots at once to avoid having to enable the Batch checkbox on each plot individually.
-
To label each page with the FCS file that is currently displayed:
- Add a text box by clicking
 in the toolbar and place it
in your illustration.
in the toolbar and place it
in your illustration. - With the text box selected, click
from the toolbar.
- Select Filename from the dropdown list. Your text box will show this variable value in a dotted outline.

- Optional: Insert other batch variables or any other text that you want in the same text box.
- Add a text box by clicking
-
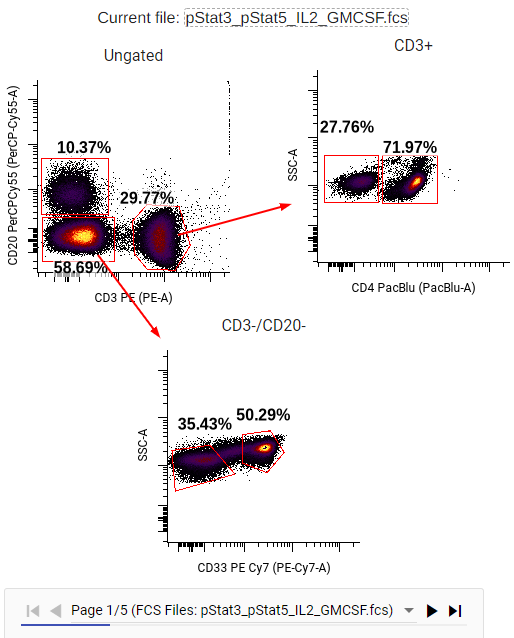
By now your gating hierarchy might look something like below. You can use the flipper controls at the bottom to view your hierarchy for other samples, or export the illustration as a PDF using the File menu.