Illustrations
Illustrations let you visualize your data and create figures for slides and publications.
Illustrations can be either used in single-page mode, or in batched layout mode. Batched illustrations allow you to create a template page, and then render that page for each value in a set of variables. For example, you could use flow plots, text boxes and arrows to create a gating hierarchy, and then render that gating hierarchy for all of your FCS files.
Creating Illustrations
To create a new, empty illustration:
Howto
- In the left sidebar, click on New Illustration. A new illustration will open with the name highlighted.
- Type in the name of the illustration.
Illustration Components
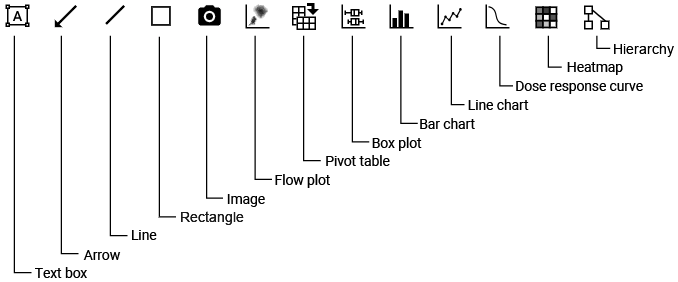
A variety of visualization types are available:
-
Flow Plots: Individual 1D and 2D flow plots (histograms and biaxials). Can be created individually or with dynamically generated gating hierarchies.
-
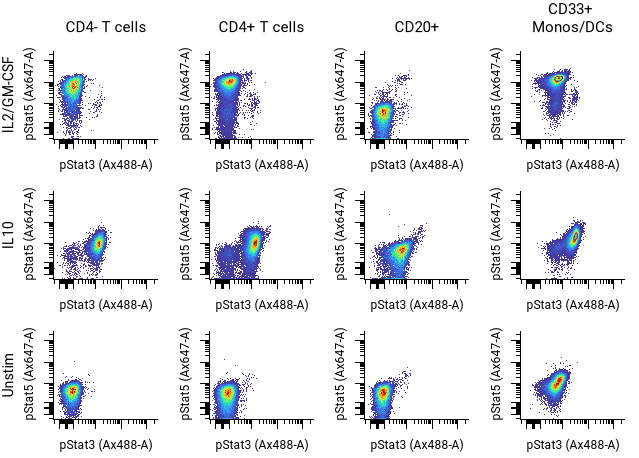
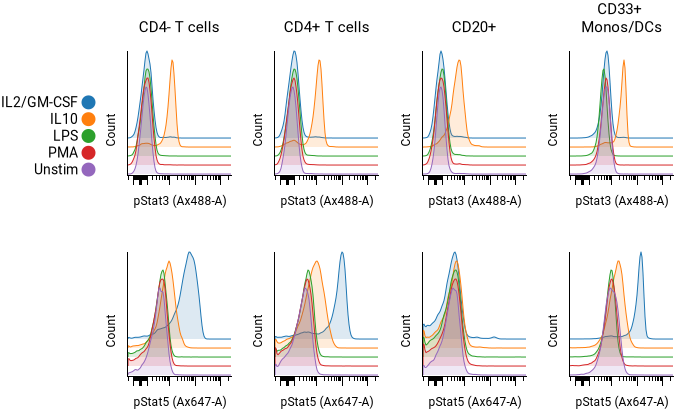
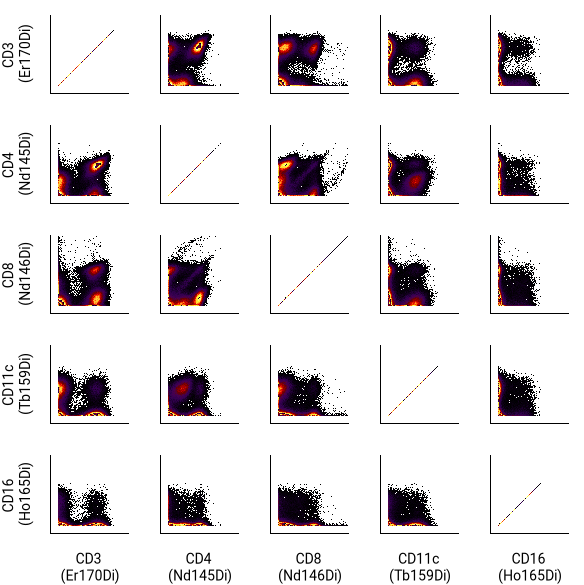
Pivot Tables: Grids of flow plots, optionally overlaid.
-
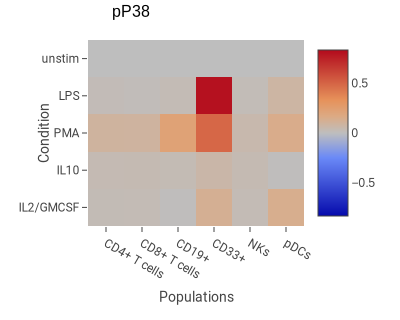
Heatmaps: A grid of statistics.
-
Bar and Line Charts: Summary figures that display channel statistics or population frequencies.
-
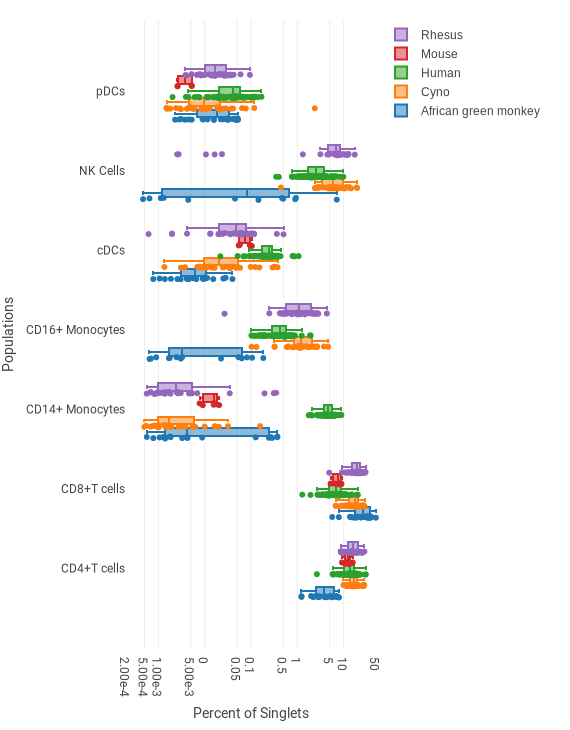
Box Plots: Display information about the distribution of datapoints, such as the median and interquartile range. Ideal for looking at experiments with many replicate conditions.
-
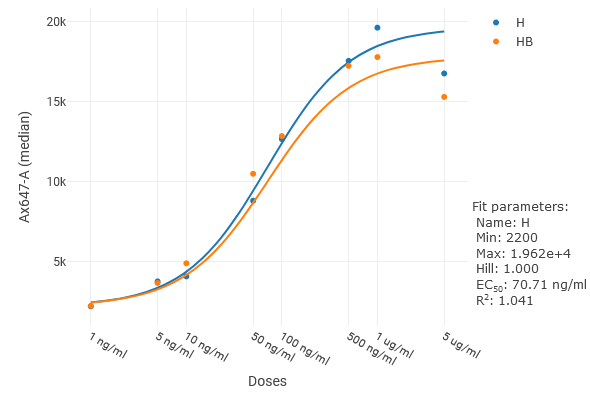
Dose Response Curves: Calculate the relationship between the dosage of a drug and a readout.
-
Basic Objects, including text boxes, images, lines, rectangles, and arrows.
Illustration Interface
Illustration functionality is accessible from the menus, toolbars and sidebar. Menus and toolbars allow you to place graphs and change illustration settings, while sidebars control the data and appearance of individual elements.
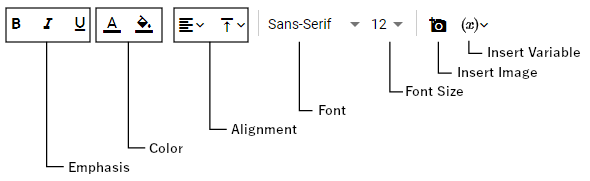
When selected, the text box adds additional toolbar options:
Lines and arrows show styling options in the toolbar when selected:
![]()
Customizing Data Visualization
The pivoting model
Pivot tables, bar charts, line charts, heatmaps and box plots all use a pivoting model to organize the data that they display. After selecting FCS file annotations to display along the X and Y dimensions (rows and columns, or axis labels and data series), files are automatically selected to populate the figure. You can also select populations or channels as X/Y dimensions, or explicitly select FCS files by filename.
Filter annotations may also be selected to limit the files displayed. For example, if you select “Plate Row” for your “rows” dimension and “Plate Column” for your “column” dimension, but have several 96-well plates in your experiment, you can use “Plate: plate 1” as a filter annotation to show data from just “plate 1.”
When you select annotations, populations and channels, they will be automatically sorted. However, you can override the default sorting by following the instructions in annotation, population and channel sorting.
Selecting Components
Multiple components can be moved, resized, and copied together. Any options that are common to all selected components can be changed simultaneously.
Multiple components can be selected by clicking and dragging a box over them with a mouse, manually with keyboard shortcuts, or from the menu, using Edit ⮞ Select.
From the menu, selection options include:
- All: Selects all components in the illustration.
- Same: Available when a component is selected, and selects additional components that match a particular feature.
- Type is available whenever a component is selected, and selects components of the same type; for example, if a heatmap is selected, this will select all heatmaps in the illustration.
- Line thickness is available when a line or arrow is selected, and selects lines and arrows with the same thickness.
- Line color is available when a line or arrow is selected, and selects lines and arrows of the same color.
- Textbox font color is available when a textbox is selected, and selects textboxes with the same font color.
- Textbox background color is available when a textbox is selected, and selects textboxes with the same background color.
- None: Deselects all components.
Arranging Components
Selected components can be moved by clicking and dragging the component to a new location on the illustration, or adjusted with keyboard shortcuts. Precise alignment and ordering of overlapping components can be accomplished by using the illustration grid and menu options.
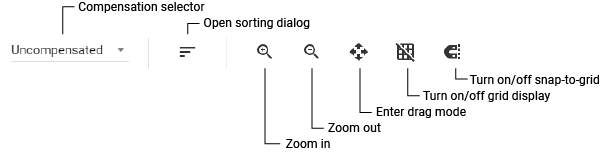
The illustration grid
To assist with alignment, each illustration has a grid. This can be used as a visual guide for illustration layout.
Howto
- To toggle the grid visibility, click on
 or
or  .
. - To control whether components will snap to the gridlines, click !
 or
or  . Snap-to works whether the grid is visible or not.
Edge and center alignment
The edges or centers of figures can be aligned automatically. The options include:
- Align Bottom/Top/Left/Right Edges aligns by the selected edge.
- Align Center positions the middle of the selected figures at the same point horizontally
- Align Midpoint positions the middle of the figures at the same point vertically.
To align components:
Howto
- Select the components to align.
- In the menu bar, choose Arrange.
- Click on the preferred Align option.
Reorder components
When components overlap, they will be displayed with the newest components on the top. To change the layering order:
Howto
- Select one or more components.
- In the menu bar, choose Arrange.
- Click on Bring Forward or Send Backward to move the selection one step forward or backward. Repeat until the selection is in the desired order position.
- Alternately, Bring to Front or Send to Back to move the selection to the top or bottom of the order.
Copying Illustrations and Components
Illustrations and components of illustrations can be copied. To duplicate an existing illustration in the same experiment:
Howto
- From:
- Illustrations, click on the File menu, and then Duplicate Illustration.
- the Summary of an experiment, right-click on the name of the illustration, and click on Duplicate.
To copy components:
Howto
- Select one or more components in an illustration.
- Use the keyboard shortcut to copy the selection.
- Open the illustration you wish to paste into.
- Use the keyboard shortcut to paste.
- If pasting into a different experiment, FCS filenames and populations will not be automatically mapped, leaving those values blank.
- Select components that need adjustment, either individually or as a group.
- In the sidebar, under Dimensions and/or General, choose the appropriate populations and/or filenames.
Tip
Illustrations can be imported from other experiments if populations are also imported at the same time.
Exporting Illustrations
An illustration, or part of an illustration, can be exported as a PDF or PNG, or pasted directly into another application.
Downloading an illustration as a PDF
Howto
- From your illustration, click the File menu, then select Download as PDF.
If the illustration is batched, then each page created by batching will be exported as a separate page in the PDF file. You can download all batched pages from the File menu, or download a subset directly from the page variables dialog:
Howto
- Click on Page Variables. This will open a dialog box.
- Select desired pages by changing the batch variable Name and/or Values.
- Click on Download PDF.
Tip
If you have read-only access, you can still change which batched pages are downloaded to a PDF, but your selections will not be saved.
See also:
Downloading parts of an illustration as a PNG or PDF
One or more components in an illustration can be downloaded as a PNG or PDF file.
Howto
- In your illustration, select one or more components.
- In the right-hand sidebar, click the Download tab.
- Under Download Selection, click Download PNG/PDF.
Copying and pasting to other applications
You can copy illustrations or parts of illustrations to other programs, such as Microsoft Office and Apple iWork applications. All selected components will be rendered into a single image when they are copied.
Howto
- Select one or more components in an illustration.
- Use the keyboard shortcut to copy the selection.
- In the destination application, use the keyboard shortcut to paste.
Changing page size for print or presentation
By default, each illustration has a generous area to position large numbers and sizes of graphs. However, you can change the size to common printing and presentation sizes and orientations. The available sizes are:
- Extra large (200 x 200 in)
- Letter portrait (8 ½ x 11 in)
- Letter landscape (11 x 8 ½ in)
- A4 portrait (210 x 297 mm)
- A4 landscape (297 x 210 mm)
- 4:3 standard slide (10 x 7.5 in)
- 16:9 widescreen slide (10 x 5 ⅝ in)
To change the size or orientation of an illustration:
Howto
- In the illustration view, click on File.
- Mouse over Page Size >.
- Click on your desired size.