Dose Response Analysis
Creating a Dose Response Plot
Howto
- Enter the dosages for each FCS file: on the annotation page, create a new column. The column can be named whatever you prefer (e.g. “dosage”).
- Type/paste/import the dosages. See dose response units for information on the format of these values.
- Create an illustration and insert a dose response chart using the
 button in the toolbar.
 - In the right sidebar, select the name of the annotation created in step 1, then select the dosage values to display.
- Select the data series. For example, these could be different signaling readouts or different cell populations that reflect on- and off-target effects.
- Select the statistic and, if applicable, channel to fit. For example, you could select a signaling marker and “median” to look at signaling activation or inhibition; or event count/percent if looking at changes in population frequencies.
- If necessary, select the population to display.
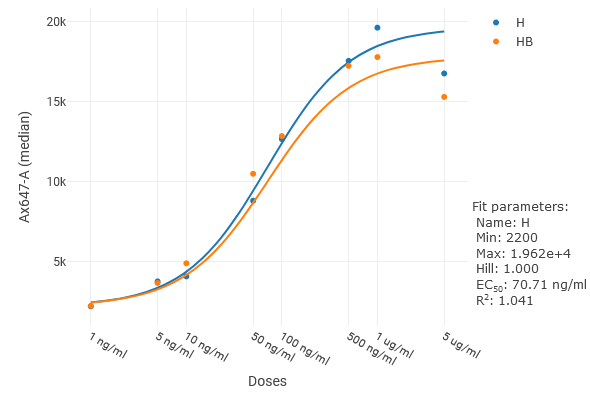
CellEngine will fit your data using the Levenberg-Marquardt method to the Hill equation:
$$ min + \frac{max - min}{1 + 10^{(logIC50 - x)} \times hill} $$
To view the model fit parameters, including EC/IC50 values, hover over a series in the legend.
To export a table of values, including χ2, R2, and EC/IC50 values:
Howto
- In the right sidebar, under Export, click download dose response fit.
Like line graphs, individual points can be selected on dose response curves to show staining profiles.
Tip
At least four dosages are required to fit a curve. Because the Hill equation calculates the log-IC50, all dosages must be greater than zero.
Dose Response Units
CellEngine automatically parses numerical dosages and a variety of unit types, spellings, abbreviations and SI prefixes, including:
- molar concentrations (e.g. “1 molar”, “2.5 nM”, “1 mole/liter”, “5 nanomole/millilitre”)
- mass-per-volume (e.g. “1 ug/ml”, “2 µg/milliliter”)
- mass-per-mass (e.g. “1 mg/kg”)
- mass (e.g. “5 grams”, “2 g”)
- moles (e.g. “1 mmol”, “5 nmol”)
- unitless (e.g. “1.0”)
All dosages with units will be normalized to nanomolar, nanomole, nanogram, milligram/liter or milligram/kilogram for curve-fitting. Unitless dosages will be used as-is.