Annotating FCS Files
Your experiments likely make comparisons between one or more different variables. For example, perhaps you’re comparing changes in abundance of a cell type across time points, or differences in signaling behavior invoked by different drugs. CellEngine lets you use your experimental conditions to drive your analysis.
The annotation table lets you input these experimental conditions. Subsequently, you can use these annotations when creating illustrations and when gating.
Tip
- You can sort by multiple columns by -clicking on column headers in sequence. Click a column header a second time to reverse its direction.
- You can copy and paste to and from spreadsheet software, such as Microsoft Excel and Google Sheets.
Automatic Annotations
CellEngine will automatically assign some annotations present in your FCS file headers, such as the plate row and plate column if the files were part of a 96- or 384-well plate.
If you have added annotations from filenames or from FCS file headers, CellEngine will also automatically repeat those actions when you upload new FCS files to the same experiment.
Custom Annotations
Custom annotations can be created by adding columns to the annotation table, and filling in values for each FCS file. You can also copy and paste values to or from spreadsheet software, such as Microsoft Excel and Google Sheets.
Importing Annotations
Annotations can be uploaded from spreadsheets (CSV, TSV, and XLSX). One column is used to match FCS files in CellEngine to rows in the spreadsheet; usually this is a filename or unique annotation like a sample ID.
To import annotations:
Howto
- In the annotation toolbar, click on Import annotations
 .
. - Paste your annotations from a spreadsheet, or drag a spreadsheet file into the box underneath Upload file.
- If you uploaded a multisheet spreadsheet, select the appropriate sheet.
- If necessary, update Header is at row with the appropriate row number.
- Click Next.
- Select a Source and/or Destination column in the dropdown to determine how FCS files are matched to annotations. (If there are columns in the experiment and the imported file with the same name, they will be automatically pre-selected.)
- Under Choose Columns to Import, select annotation columns to import into CellEngine.
- Click Import.
Adding Annotations from Filenames
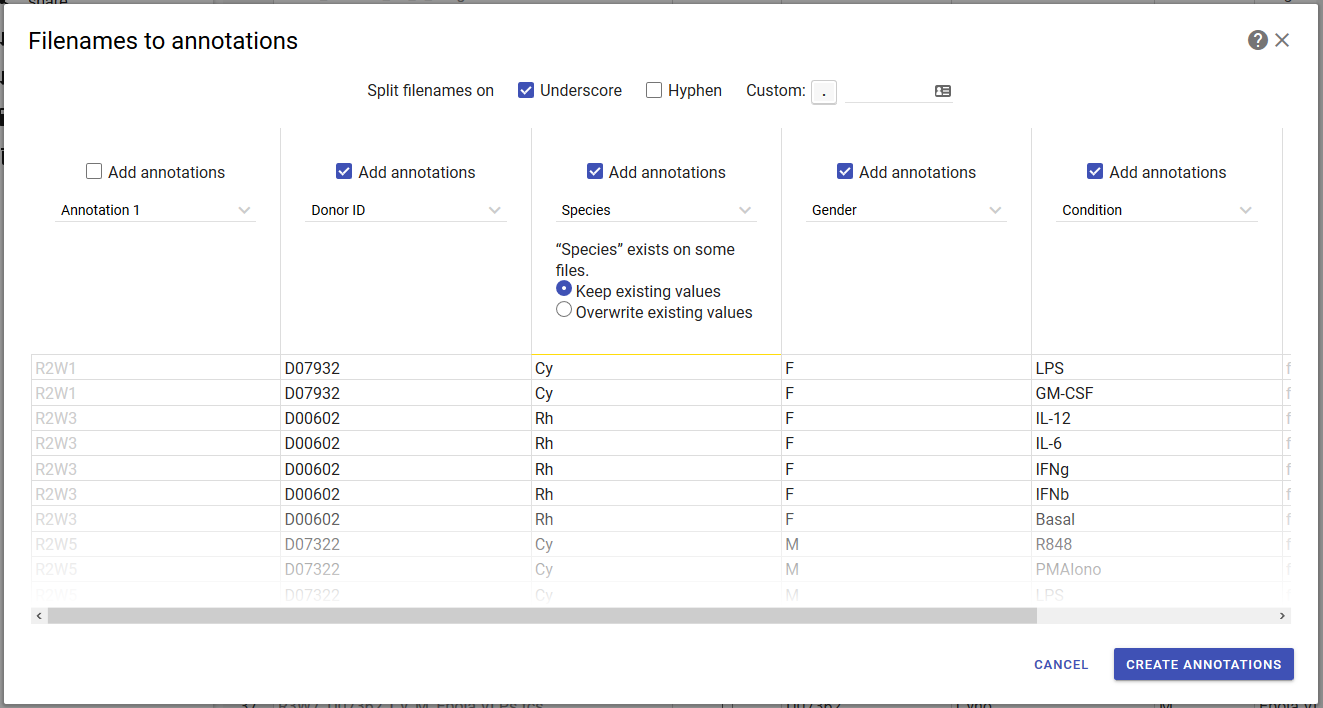
If your files are systematically named such that they include annotation information, such as “Donor 1_Day 0_100 mg.fcs”, you can use the filenames-to-annotations tool to extract this information into separate columns. This is akin to using the text-to-columns tool in spreadsheet applications.
Howto
- In the annotate page, click the filenames to annotations button in the toolbar. A dialog will open.
- Select what characters to split the filenames on (underscore, hyphen or custom characters that you enter). Review the preview pane to see the result.
- Optionally, uncheck the boxes above columns that you wish to omit.
- Enter names for the new columns. If you attempt to use a name that already exists, you will be asked if you want to keep the existing annotation values, or replace the existing values with new values. (This is shown in the example above for the species column.)
- Click create annotations.
Tips
-
Hold down when checking or unchecking columns to include or omit all of them.
-
Before using this tool, you can change the names of your FCS files to correct typos and add any missing annotations/formatting.
Note that files marked “Control” will not be processed.
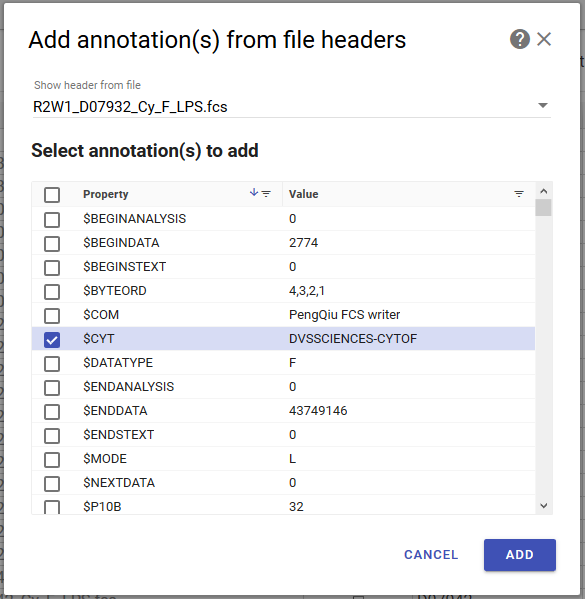
Adding Annotations from FCS File Headers
You can extract metadata from FCS file headers into new annotations. Some examples
of potentially useful header values are $BTIM (the beginning acquisition timestamp),
$DATE (the acquisition date) and $TOT (number of events in the file).
Howto
- In the annotate page, click the add annotation from file headers button in the toolbar. A dialog will open.
- Select what header keys to extract. The header values for one FCS file are shown as a preview. You can change which file to preview using the file selector at the top.
- Click add. A new column will appear for each selected header key.
Viewing Annotation History
When an annotation is modified by a user, any changes that are made to values are recorded. The edit history includes the name of the user who made the change, the timestamp, and the new value.
Howto
- Right-click on a cell in annotations.
- Click on View edit history.
Exporting Annotations
To download a file with your annotations:
Howto
- In the annotation toolbar, click on Export annotations
 .
. - Choose a file format from the dropdown list.
Control Files
Files set as “control files” will only be visible in the compensation editor, the experiment summary, and the annotations page. This lets you exclude compensation controls, calibration beads, and other files that you don’t want to see in your analysis.
Moving Columns
Imported annotation columns will be added to the end of the annotation table. To change the location of a column:
Howto
- Select a column by clicking on the header cell. (Clicking directly on the column letter will sort the column, so click in the adjacent empty space.)
- Optional: +click additional columns to add to your selection.
- Click and drag the column header to the new location.
Tip
The first three columns are reserved for Filename, Control, and Gates Locked, and are fixed in place.
Filter Files
Any list of FCS files can be filtered by annotation values. Filters can be set for multiple annotations simultaneously. This can be useful throughout analysis, including gating particular subsets of files (perhaps with a different antibody panel or cell type), creating a flow plot for a particular file, examining a particular sample’s figures within a batched illustration, or exporting statistics.
To filter FCS file lists:
Howto
- Click on
 Filter in the top cell to bring up a dropdown list of the annotation values.
 - Optional: Type in the search box to limit the values displayed.
- Check one or more values.
To cancel filtering:
Howto
- Click on Filter on the annotation column you want to stop filtering.
- Click on
 .
.
Annotation, Population and Channel Sorting
Default (automatic) sort order
By default, annotations sort based on the detected type of annotation. For example, plate rows and columns sort row-wise from A1 to H12 (96-well) or P24 (384-well), numerical values with or without units sort based on their normalized values, common date formats sort chronologically, and plain text sorts alphabetically.
Populations sort alphabetically by name.
Channels sort alphabetically by the channel name or numerically by mass channel (CyTOF).
Defining custom sort orders
You can manually change the sort order for annotations, populations and channels at the three different levels listed below. Sorting is hierarchical: if a sort order is not defined at one level, the next level’s sort order is used. For example, if you have not set a sort order for an illustration, then the experiment’s sort order is used.
-
Experiment affects all illustrations. This can be set from the annotation page and from any illustration.
Warning
Changing the experiment-level sorting will alter any existing illustrations that don’t have illustration or component-level sort orders defined.
-
Illustration affects components in the current illustration. This can only be set from an illustration. If defined, this overrides the experiment-level sort order.
-
Illustration Component affects the selected component in the illustration. This can only be set from an illustration while a component is selected. If defined, this overrides the illustration- and experiment-level sort orders.
Defining a custom annotation sort order from the annotation table
Howto
- In the annotate page, click the header of the column that you wish to adjust.
- Click the change display order button in the toolbar. A dialog will open.
- Select a value to move, then use the four move buttons to adjust its sort order.
Defining a custom annotation, population or channel sort order from illustrations
Howto
- In an illustration, click either the change illustration sorting order button in the toolbar, or the change display order button in the annotation value selector in the sidebar (visible while a component is selected). A dialog will appear.
- Pick the level for which you wish to define the sort order: experiment, illustration or selected illustration component (see the description of these three levels above).
- Pick the property for which you wish to define the sort order. This can be an annotation, or populations or channels.
- Pick the sort by mode.
- To defer to the sort order defined at the next-highest level, select the left-most option. For example, while “illustration” is selected, you can choose to sort by “experiment order.” This effectively clears the sort order for the selected property at the selected level.
- To use the automatic sort order (see default (automatic) sort order above), select “automatic.”
- To use your own sort order, use the four move buttons to adjust the options in the list. “Custom” sort mode will be automatically selected.
- Click save to apply your changes.
Annotation Validators
You can optionally add validators to annotation columns. There are three kinds of validators:
- Enum validators require that all values in the column come from a set of allowed values. For example, you can specify that the “Patient ID” column is only allowed to contain the values “P12001”, “Y12002”, “Z12003” and “D12004”. An attempt to enter “K12006” would be flagged and rejected.
- Min and max validators require that numerical values are within a range. For example, you can specify that the “Day” column is only allowed to contain values between 0 and 60. An attempt to enter 61 would be flagged and rejected.
- Required validators require that a value is present for all files. If a file is missing a value, it will be flagged.
Validators are useful in 21 CFR 11-compliant workflows; see Input Checks for more information.
Creating and Editing Validators
Howto
- In the annotation page, select the column you wish to modify.
- Click
 (edit validators) in the toolbar. A dialog will open.
 - Enter the desired validators, as described above, then click Save validator.
- If you already had values in the selected column, they will be validated. Invalid values will turn red, and the toolbar will display a count of how many invalid values are present. You can use the previous/next buttons in the toolbar to quickly find invalid values in the table. When the entire table is valid, the edit validators icon will have a green dot.
Note: if a row if already valid, you will not be able to enter an invalid value. Enter a correct value instead, or hit esc to cancel the change.
Event Count per µl
The “Event Counts per µl” feature allows populations to be expressed in terms of events per µl (microliter) of sample, rather than raw counts.
There are three ways to use the feature described below. Subsequently, you can select "events per µl" as a gate label and as an exportable statistic value.
From a known bead concentration
Use this method when adding adding beads in solution at a known concentration to your sample.
Howto
- Gate a population containing the beads.
- Add an annotation with the bead concentration in each sample in the form of "1234/nl", "1234/ul", "1234/µl" or "1234/ml".
- In the annotation toolbar, click
 . A dialog will open.
 - Choose from bead concentration.
- Choose the annotations created above.
- Choose the bead population gated above.
- Click set.
- If any annotation values cannot be parsed, they will be flagged red for correction.
From a known bead count and sample volume
Use this method when adding your sample to tubes with a known number of lyophilized beads.
Howto
- Gate a population containing the beads.
- Add two annotations: one with the sample volume (with "nl", "ul", "µl" or "ml" units, or without units) and the other with the bead count.
- In the annotation toolbar, click . A dialog will open.
- Choose From bead number and sample volume.
- Choose the annotations created above.
- Choose the bead population gated above.
- Click set.
- If any annotation values cannot be parsed, they will be flagged red for correction.
From a known sample volume
Use this method if you have a volumetric flow cytometer or otherwise know exactly how much sample was acquired, and are not using counting beads.
Howto
- Add an annotation with volumes for each sample (with "nl", "ul", "µl" or "ml" units, or without units). Some cytometers encode the sample volume in the
$VOLheader value. This value can be retrieved by adding Annotations from FCS file headers. - In the annotation toolbar, click . A dialog will open.
- Choose from sample volume.
- Choose the annotation created above.
- Choose the unit for the annotation. The
$VOLheader, if used, is nl (nanoliters). Note: this unit is only used if your annotation values do not include units. - Click set.
- If any annotation values cannot be parsed, they will be flagged red for correction.